Weekly:
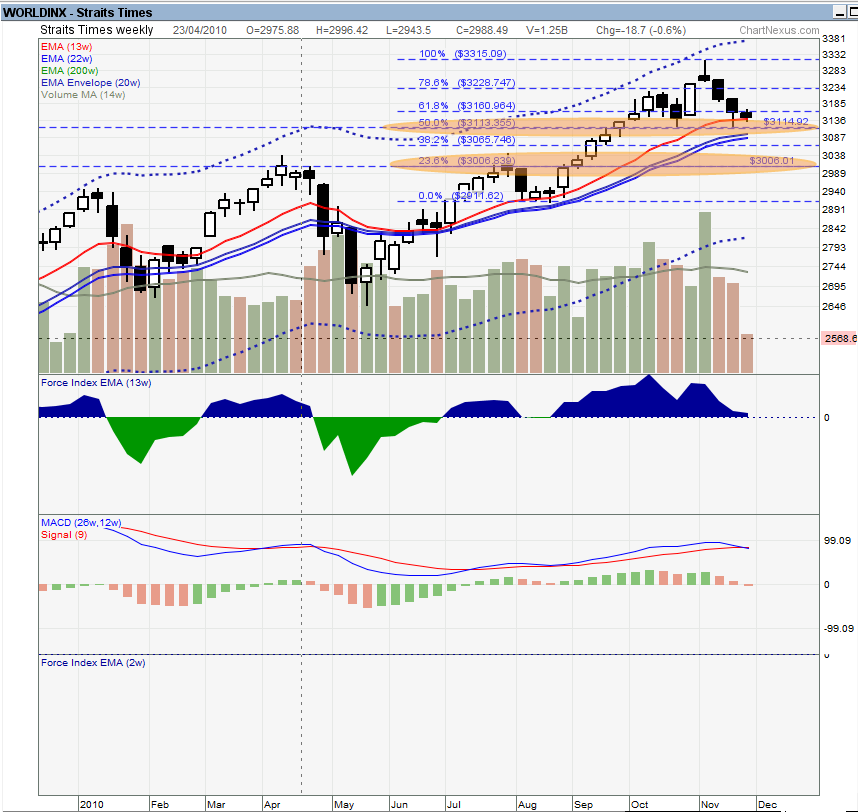
The weekly chart for STI shows a rather bleak picture. I identified 2 support lines, one at around 3100, the other at 3000 (I only give to 2 significant figures), which also coincides with the fibo retracement lines of 50% and 23.6% respectively. I think 3100 is strong because it's sitting on the value zone. Historically, the ema 22w had been a strong moving support line for STI, so it's good to see if STI breaks below that moving support. MACD lines looks bleak with an impending cross-over on the downside, but it could mean nothing. If this breaks, another strong support line will be at 3000. Since it's the resistance at the previous 2 peaks, it should be a rather strong support. That better don't break, if not we going to hurdle down towards sub 3000 levels. Not pretty at all.
Daily:

Daily chart shows pretty much the same picture as the weekly - bleak. There's a bearish pattern called head and shoulders that can be seen, with the neckline at 3114 level. If the pattern works out, the price objective of the heads and shoulders pattern could go around 2900. The moving average lines should now act as the moving resistance line that prevents the price from going above it, until the trend is broken that is. Is this a good time to enter? I think not. Most BB should have take break for the rest of the year already, so volume should be dwindling towards the end of the year. I think at best the market should be going sideways, at worst a downright gentle slide down.
Action:
Do nothing when there's nothing to do. I'll look out for signs of reversal (break trendline + divergence) before doing any trades. As for keeps, I'll wait for a suitable price based on individual charts to decide if I want to enter more on whatever I'm holding. Suitable price is based on both charts and the yield at buy price.


0 comments :
Post a Comment